This study aims to examine the patterns of urbanisation and UHI distribution in Melbourne from 2001-2020 in order to see the changes that have occurred over an extensive period of time. These changes will be explored in relation to each other in order to drive the association of these two potentially phenomena factors on the Metropolitan area of Melbourne. A geospatial approach will be used throughout this paper, utilising cloud computing, remote sensing, and spatial analysis. UHIs will be derived from satellite imagery, while NDVI and NDBI will be used as measures of urbanisation by measuring vegetation health and built-up level respectively, as well as being combined in the form of the Built-Up Index (BUI).
This study focuses on the interaction of surface temperatures and the urban environment in the metropolitan region of Melbourne, Australia. Melbourne is the business and administration capital of the state of Victoria, with an associated population of 5 159 211 during the 2019-2020 financial year (Australian Bureau of Statistics 2021), and has an extent of 9992.5 km2 as of 2016 (City of Melbourne 2021). Urbanisation is of particular concern in Melbourne as from July 1 2019 to June 30 2020, Melbourne experienced a population growth of 80,100 people (a growth rate of 1.6%), firmly cementing the city as the second most populous in the country (Australian Bureau of Statistics 2021). It is projected that this number will have increased to over 9 million by 2056 (DELWP 2019). Adding to the concern of urbanisation is the occurrence of high temperatures within the city. In 2020 Melbourne’s mean temperature was 19.0°C, with a maximum recorded reading of 42.9°C on January 31st. This temperature was recorded following a period of extreme warm temperatures across south-eastern Australia, where towards the end of January temperatures were recorded at 40°C or above almost daily in Melbourne, with temperature records set across both the state and country (Bureau of Meteorology 2021). With increasing urban populations as well as experiencing high temperatures and record heat waves, Melbourne has become an important study area for research into the relationship between natural and built environments.
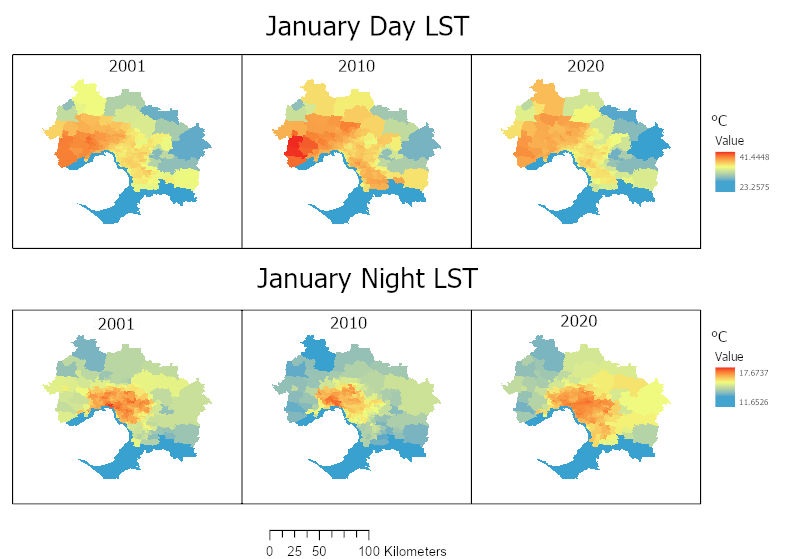
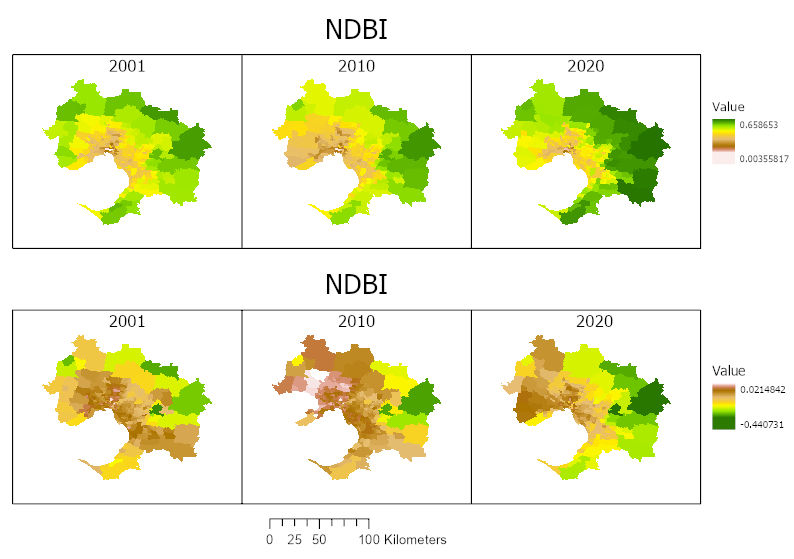
The results of this study are to be finalised, but some preliminary results are included below.
LST, NDBI and NDVI
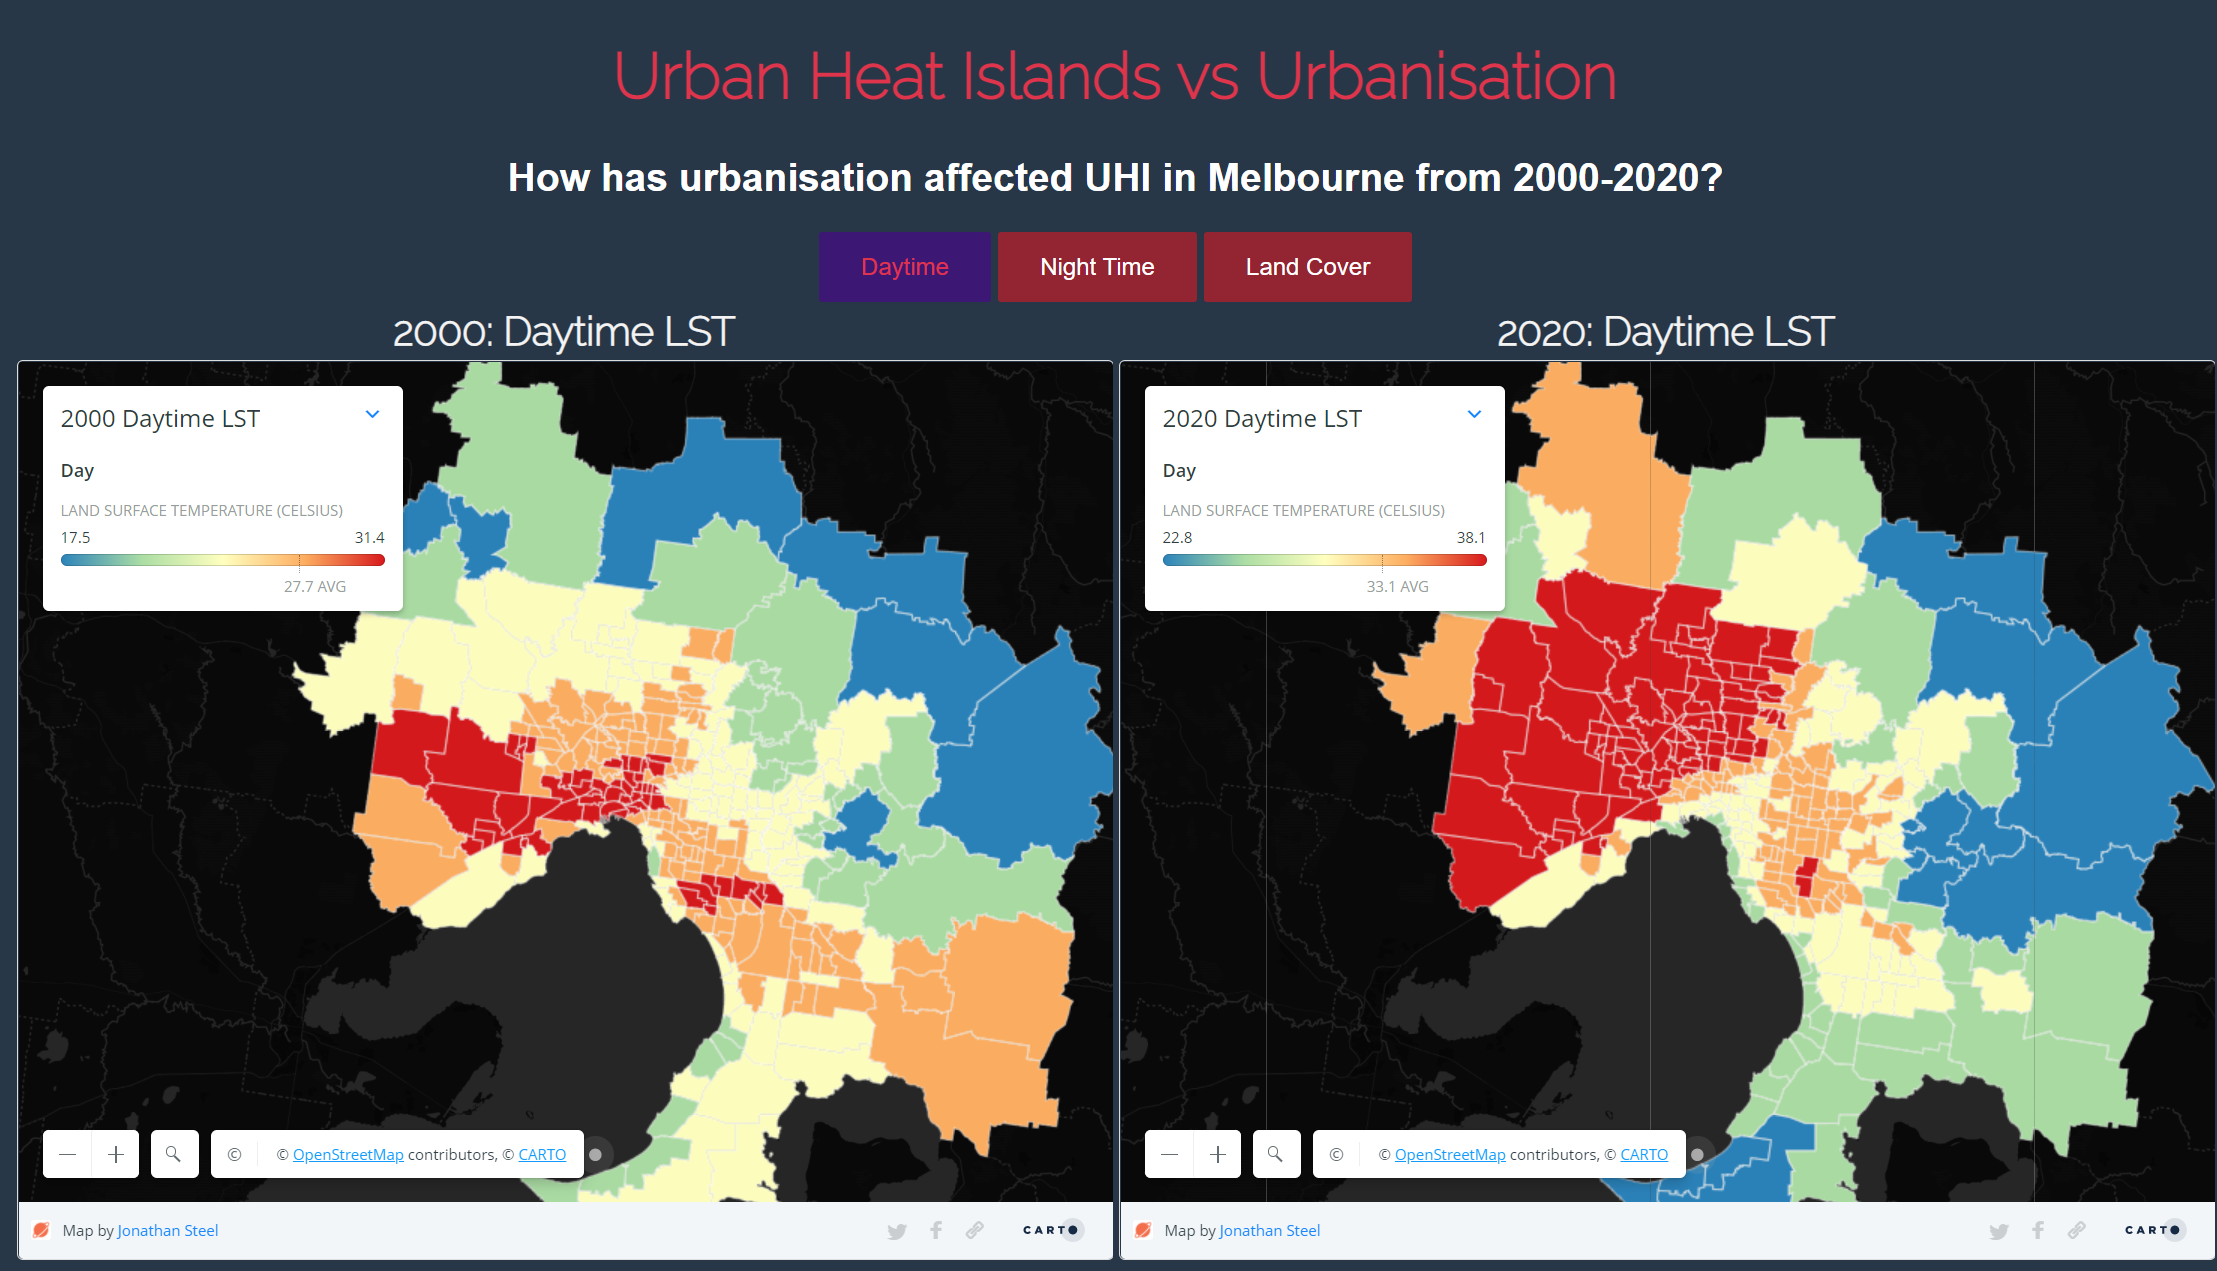
A more deatiled look at the land surface temperature of Melbourne can be observed from the interactive maps below. These maps formed part of a an interactive website (see below image).
Interactive Maps
Interactive Website